
Introduction
In my previous post, I said that I would attempt to calculate and compare the Upside and Downside Capture Ratio for a very large dataset. At the time of my analysis, the NASDAQ comprised of 3210 companies! The goal of this post became to calculate and compare the Upside and Downside Capture Ratio for all securities traded on NASDAQ.
By completion, my work was a success. I used R to identify sectors that were most likely to succeed regardless of market conditions. Since 2013, sectors that were most likely to provide alpha in both weak and strong market conditions were Consumer Durables, Transportation and Consumer Non-Durables.

Figure 1, Capture Ratios for NASDAQ
Previously, I introduced Upside and Downside Capture Ratio (UPR and DPR). The purpose of the ratio is to establish performance of an investment, usually a mutual fund, against the rise and fall of a bench mark. The bench mark, for my project, is the Wilshire 5000 Total Market Cap Index.
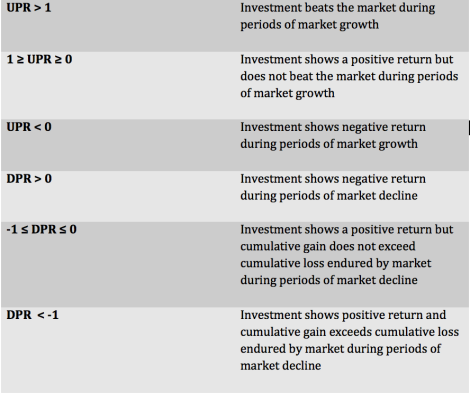
Table 1, Detailed Description of UPR and DPR
Table 1 explains the meaning behind certain ranges of UPR and DRP values.
Technique
In my Oil&Gas Series, I made use of a dataset NASDAQ had made publicly available to extract names of petroleum extraction and production firms. I use the same dataset for my analysis.
Using return ratios, I plan to plot the upside against the downside. Ideally, the best investments would be in the green area (Figure 2). Investments useful in hedging can be outside this region. The red region represents investments that do not provide any substantive growth or decline compared to the market.
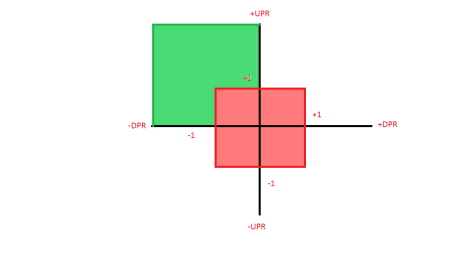
Figure 2, Visual Representation of DPR vs UPR
Results
Adding live updates on progress as the code executed helped the hour long wait (Figure 3). Error handling allowed for my code to skip over particularly difficult data downloads – for example, if a function was not able to locate a certain stock by its ticker. Skipped companies were flagged in the final list to filter failed downloads out. Stocks that had an unusual spike in price over a short period of time were also filtered out – as this indicates a new company releasing an IPO after our minimum year specification. New companies were not useful to our analysis as he goal was to identify successful long-standing firms.
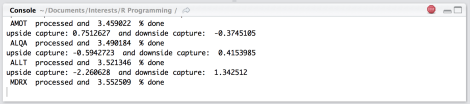
Figure 3, Live Updates during Progress
Of the 3209 companies on the NASDAQ, 28% companies were flagged as having possibly erroneous, irrelevant or unreliable data. Another package, ggplot2, produced more intuitive and engaging graphs.
My coding can be downloaded here.
Analysis
By grouping industries together, I had a bird’s eye view of their performance.

Figure 4, UCR and DCR by Industry
Industry in the top-left quadrant are deemed strong enough to withstand weak economic climate. The strongest industries are Finance, Consumer Durables and Transportation with 24%, 22% and 21% of companies placed in the top-left quadrant respectively (Figure 4). The weakest industries are Energy, Health and Technology with 2%, 5% and 7% of companies placed in the top-left quadrant respectively.
Companies in the green area (Figure 2), provide alpha, or excess return, despite economic climate. These industries are Consumer Durables, Transportation and Consumer Non-Durables with 4%, 3% and 2% of companies placed in the green area respectively.
Issues worth considering are the huge gap in sample size per Industry. Only 36 Energy-related stocks were taken into our analysis – as opposed to 452 Financial, 412 Health Care and 343 Technology stocks. Further analysis should consider additional datasets in conjunction to the NASDAQ. Further clarification is needed for stocks labelled as “N/A” and “Miscellaneous”. Together, these unlabelled stocks account for 16% of all our studied stocks.
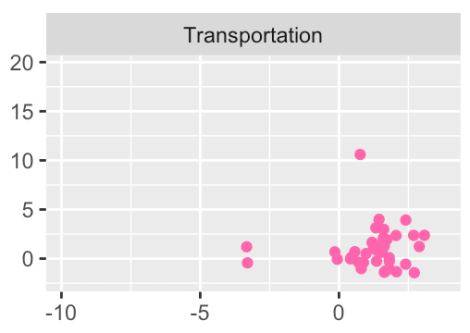
Figure 5, Small sample size for particular industries can cause concern
Bibliography
http://www.nasdaq.com/screening/company-list.aspx
Appendix
The final codes for download are: http://bit.ly/UpsideDownsideNASDAQ
